COMPSs Tools
Application graph
At the end of the application execution a dependency graph can be
generated representing the order of execution of each type of task and
their dependencies. To allow the final graph generation the -g flag
has to be passed to the runcompss command; the graph file is written
in the base_log_folder/monitor/complete_graph.dot at the end of the
execution.
Figure 15 shows a dependency graph example of a SparseLU java application. The graph can be visualized by running the following command:
compss@bsc:~$ compss_gengraph ~/.COMPSs/sparseLU.arrays.SparseLU_01/monitor/complete_graph.dot
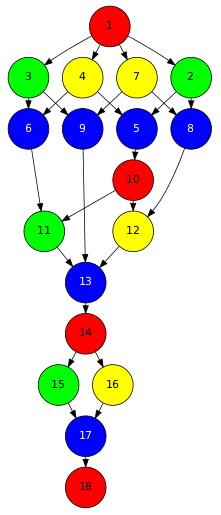
Figure 15 The dependency graph of the SparseLU application
COMPSs Monitor
The COMPSs Framework includes a Web graphical interface that can be used to monitor the execution of COMPSs applications. COMPSs Monitor is installed as a service and can be easily managed by running any of the following commands:
compss@bsc:~$ /etc/init.d/compss-monitor usage
Usage: compss-monitor {start | stop | reload | restart | try-restart | force-reload | status}
Service configuration
The COMPSs Monitor service can be configured by editing the
/opt/COMPSs/Tools/monitor/apache-tomcat/conf/compss-monitor.conf file which contains
one line per property:
- COMPSS_MONITOR
- Default directory to retrieve monitored applications
(defaults to the
.COMPSsfolder inside therootuser). - COMPSs_MONITOR_PORT
- Port where to run the compss-monitor web service (defaults to 8080).
- COMPSs_MONITOR_TIMEOUT
- Web page timeout between browser and server (defaults to 20s).
Usage
In order to use the COMPSs Monitor users need to start the service as shown in Figure 16.
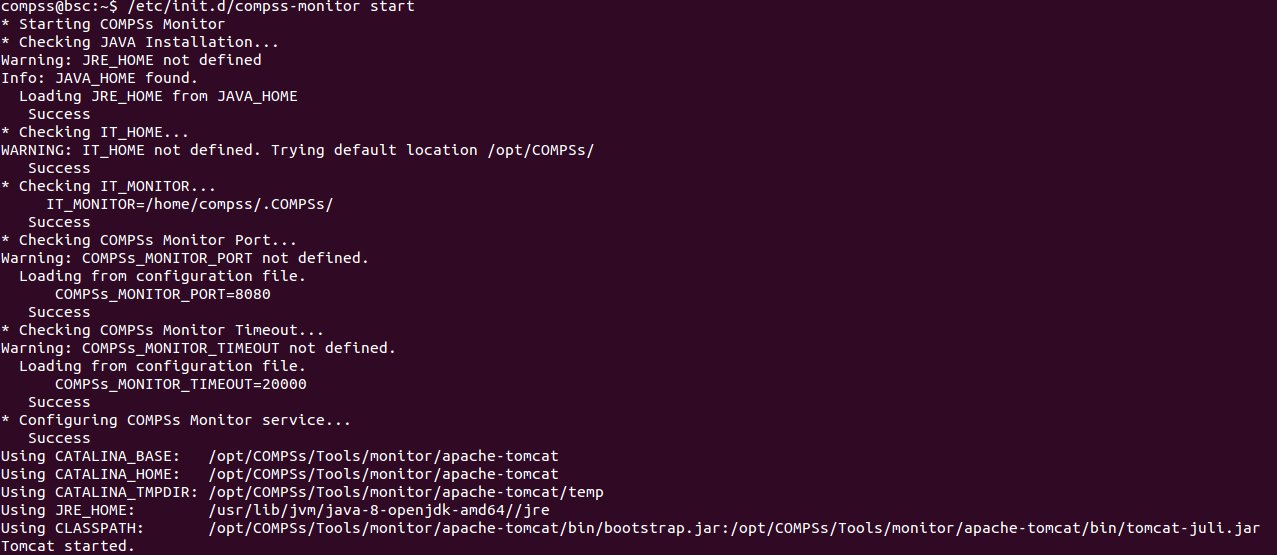
Figure 16 COMPSs Monitor start command
And use a web browser to open the specific URL:
compss@bsc:~$ firefox http://localhost:8080/compss-monitor &
The COMPSs Monitor allows to monitor applications from different users and thus, users need to first login to access their applications. As shown in Figure 17, the users can select any of their executed or running COMPSs applications and display it.
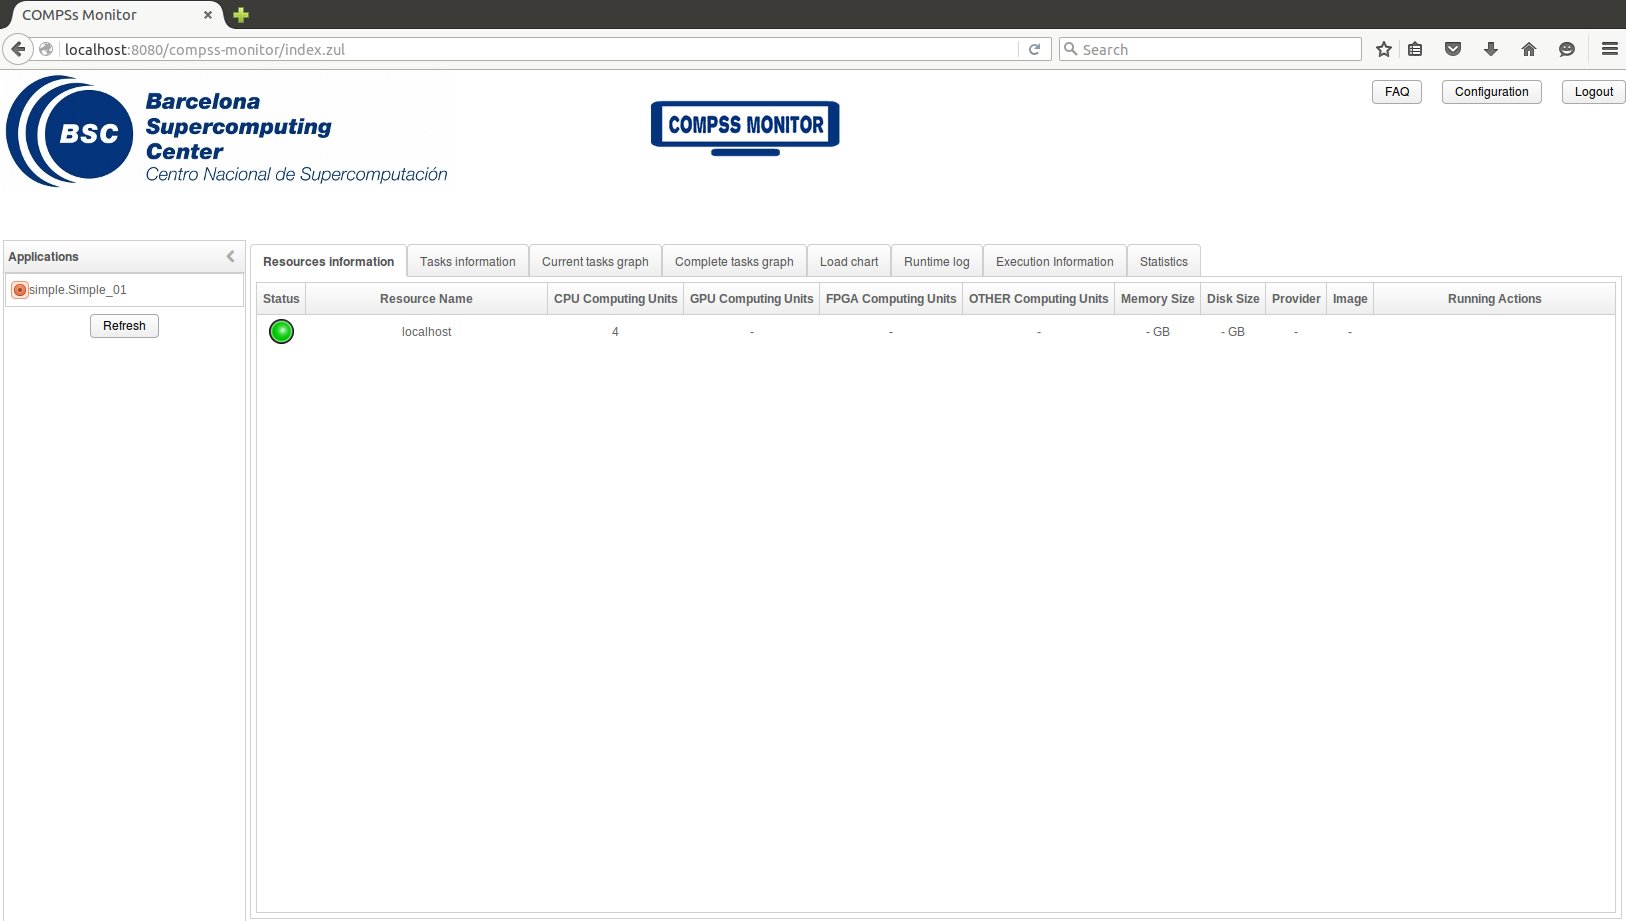
Figure 17 COMPSs monitoring interface
To enable all the COMPSs Monitor features, applications must run the
runcompss command with the -m flag. This flag allows the COMPSs
Runtime to store special information inside inside the
log_base_folder under the monitor folder (see
Figure 17 and Figure 18). Only
advanced users should modify or delete any of these files. If the
application that a user is trying to monitor has not been executed with
this flag, some of the COMPSs Monitor features will be disabled.
compss@bsc:~/tutorial_apps/java/simple/jar$ runcompss -dm simple.Simple 1
[  INFO] Using default execution type: compss
[  INFO] Using default location for project file: /opt/COMPSs/Runtime/configuration/xml/projects/default_project.xml
[  INFO] Using default location for resources file: /opt/COMPSs/Runtime/configuration/xml/resources/default_resources.xml
[  INFO] Using default language: java

----------------- Executing simple.Simple --------------------------

WARNING: COMPSs Properties file is null. Setting default values
[(799)    API]  -  Deploying COMPSs Runtime v<version>
[(801)    API]  -  Starting COMPSs Runtime v<version>
[(801)    API]  -  Initializing components
[(1290)    API]  -  Ready to process tasks
[(1293)    API]  -  Opening /home/compss/tutorial_apps/java/simple/jar/counter in mode OUT
[(1338)    API]  -  File target Location: /home/compss/tutorial_apps/java/simple/jar/counter
Initial counter value is 1
[(1340)    API]  -  Creating task from method increment in simple.SimpleImpl
[(1340)    API]  -  There is 1 parameter
[(1341)    API]  -    Parameter 1 has type FILE_T
Final counter value is 2
[(4307)    API]  -  No more tasks for app 1
[(4311)    API]  -  Getting Result Files 1
[(4340)    API]  -  Stop IT reached
[(4344)    API]  -  Stopping Graph generation...
[(4344)    API]  -  Stopping Monitor...
[(6347)    API]  -  Stopping AP...
[(6348)    API]  -  Stopping TD...
[(6509)    API]  -  Stopping Comm...
[(6510)    API]  -  Runtime stopped
[(6510)    API]  -  Execution Finished

------------------------------------------------------------
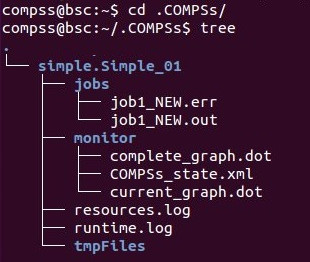
Figure 18 Logs generated by the Simple java application with the monitoring flag enabled
Graphical Interface features
In this section we provide a summary of the COMPSs Monitor supported features available through the graphical interface:
- Resources information Provides information about the resources used by the application
- Tasks information Provides information about the tasks definition used by the application
- Current tasks graph Shows the tasks dependency graph currently stored into the COMPSs Runtime
- Complete tasks graph Shows the complete tasks dependecy graph of the application
- Load chart Shows different dynamic charts representing the evolution over time of the resources load and the tasks load
- Runtime log Shows the runtime log
- Execution Information Shows specific job information allowing users to easily select failed or uncompleted jobs
- Statistics Shows application statistics such as the accumulated cloud cost.
Important
To enable all the COMPSs Monitor features applications must run with the -m flag.
The webpage also allows users to configure some performance parameters of the monitoring service by accessing the Configuration button at the top-right corner of the web page.
For specific COMPSs Monitor feature configuration please check our FAQ section at the top-right corner of the web page.
Application tracing
COMPSs Runtime can generate a post-execution trace of the execution of the application. This trace is useful for performance analysis and diagnosis.
A trace file may contain different events to determine the COMPSs master state, the task execution state or the file-transfers. The current release does not support file-transfers informations.
During the execution of the application, an XML file is created in the worker nodes to keep track of these events. At the end of the execution, all the XML files are merged to get a final trace file.
In this manual we only provide information about how to obtain a trace and about the available Paraver (the tool used to analyze the traces) configurations. For further information about the application instrumentation or the trace visualization and configurations please check the Tracing Section.
Trace Command
In order to obtain a post-execution trace file one of the following
options -t, --tracing, --tracing=true, --tracing=basic must
be added to the runcompss command. All this options activate the
basic tracing mode; the advanced mode is activated with the option
--tracing=advanced. For further information about advanced mode check
the COMPSs applications tracing
Section. Next, we provide an example of the command execution with the basic
tracing option enabled for a java K-Means application.
compss@bsc:~$ runcompss -t kmeans.Kmeans
*** RUNNING JAVA APPLICATION KMEANS
[  INFO] Relative Classpath resolved: /path/to/jar/kmeans.jar

----------------- Executing kmeans.Kmeans --------------------------

Welcome to Extrae VERSION
Extrae: Parsing the configuration file (/opt/COMPSs/Runtime/configuration/xml/tracing/extrae_basic.xml) begins
Extrae: Warning! <trace> tag has no <home> property defined.
Extrae: Generating intermediate files for Paraver traces.
Extrae: <cpu> tag at <counters> level will be ignored. This library does not support CPU HW.
Extrae: Tracing buffer can hold 100000 events
Extrae: Circular buffer disabled.
Extrae: Dynamic memory instrumentation is disabled.
Extrae: Basic I/O memory instrumentation is disabled.
Extrae: System calls instrumentation is disabled.
Extrae: Parsing the configuration file (/opt/COMPSs/Runtime/configuration/xml/tracing/extrae_basic.xml) has ended
Extrae: Intermediate traces will be stored in /user/folder
Extrae: Tracing mode is set to: Detail.
Extrae: Successfully initiated with 1 tasks and 1 threads

WARNING: COMPSs Properties file is null. Setting default values
[(751)    API]  -  Deploying COMPSs Runtime v<version>
[(753)    API]  -  Starting COMPSs Runtime v<version>
[(753)    API]  -  Initializing components
[(1142)   API]  -  Ready to process tasks
...
...
...
merger: Output trace format is: Paraver
merger: Extrae 3.3.0 (revision 3966 based on extrae/trunk)
mpi2prv: Assigned nodes < Marginis >
mpi2prv: Assigned size per processor < <1 Mbyte >
mpi2prv: File set-0/TRACE@Marginis.0000001904000000000000.mpit is object 1.1.1 on node Marginis assigned to processor 0
mpi2prv: File set-0/TRACE@Marginis.0000001904000000000001.mpit is object 1.1.2 on node Marginis assigned to processor 0
mpi2prv: File set-0/TRACE@Marginis.0000001904000000000002.mpit is object 1.1.3 on node Marginis assigned to processor 0
mpi2prv: File set-0/TRACE@Marginis.0000001980000001000000.mpit is object 1.2.1 on node Marginis assigned to processor 0
mpi2prv: File set-0/TRACE@Marginis.0000001980000001000001.mpit is object 1.2.2 on node Marginis assigned to processor 0
mpi2prv: File set-0/TRACE@Marginis.0000001980000001000002.mpit is object 1.2.3 on node Marginis assigned to processor 0
mpi2prv: File set-0/TRACE@Marginis.0000001980000001000003.mpit is object 1.2.4 on node Marginis assigned to processor 0
mpi2prv: File set-0/TRACE@Marginis.0000001980000001000004.mpit is object 1.2.5 on node Marginis assigned to processor 0
mpi2prv: Time synchronization has been turned off
mpi2prv: A total of 9 symbols were imported from TRACE.sym file
mpi2prv: 0 function symbols imported
mpi2prv: 9 HWC counter descriptions imported
mpi2prv: Checking for target directory existance... exists, ok!
mpi2prv: Selected output trace format is Paraver
mpi2prv: Stored trace format is Paraver
mpi2prv: Searching synchronization points... done
mpi2prv: Time Synchronization disabled.
mpi2prv: Circular buffer enabled at tracing time? NO
mpi2prv: Parsing intermediate files
mpi2prv: Progress 1 of 2 ... 5% 10% 15% 20% 25% 30% 35% 40% 45% 50% 55% 60% 65% 70% 75% 80% 85% 90% 95% done
mpi2prv: Processor 0 succeeded to translate its assigned files
mpi2prv: Elapsed time translating files: 0 hours 0 minutes 0 seconds
mpi2prv: Elapsed time sorting addresses: 0 hours 0 minutes 0 seconds
mpi2prv: Generating tracefile (intermediate buffers of 838848 events)
         This process can take a while. Please, be patient.
mpi2prv: Progress 2 of 2 ... 5% 10% 15% 20% 25% 30% 35% 40% 45% 50% 55% 60% 65% 70% 75% 80% 85% 90% 95% done
mpi2prv: Warning! Clock accuracy seems to be in microseconds instead of nanoseconds.
mpi2prv: Elapsed time merge step: 0 hours 0 minutes 0 seconds
mpi2prv: Resulting tracefile occupies 991743 bytes
mpi2prv: Removing temporal files... done
mpi2prv: Elapsed time removing temporal files: 0 hours 0 minutes 0 seconds
mpi2prv: Congratulations! ./trace/kmeans.Kmeans_compss_trace_1460456106.prv has been generated.
[   API]  -  Execution Finished

------------------------------------------------------------
At the end of the execution the trace will be stored inside the
trace folder under the application log directory.
compss@bsc:~$ cd .COMPSs/kmeans.Kmeans_01/trace/
compss@bsc:~$ ls -1
kmeans.Kmeans_compss_trace_1460456106.pcf
kmeans.Kmeans_compss_trace_1460456106.prv
kmeans.Kmeans_compss_trace_1460456106.row
Trace visualization
The traces generated by an application execution are ready to be visualized with Paraver. Paraver is a powerful tool developed by BSC that allows users to show many views of the trace data by means of different configuration files. Users can manually load, edit or create configuration files to obtain different trace data views.
If Paraver is installed, issue the following command to visualize a given tracefile:
compss@bsc:~$ wxparaver path/to/trace/trace_name.prv
For further information about Paraver please visit the following site: http://www.bsc.es/computer-sciences/performance-tools/paraver
COMPSs IDE
COMPSs IDE is an Integrated Development Environment to develop, compile, deploy and execute COMPSs applications. It is available through the Eclipse Market as a plugin and provides an even easier way to work with COMPSs.
For further information please check the COMPSs IDE User Guide available at: http://compss.bsc.es .