Interpretation
This section explains how to interpret a trace view once it has been adjusted as described in the previous section.
- The trace view has on its horizontal axis the execution time and on the vertical axis one line for the master at the top, and below it, one line for each of the workers.
- In a line, the light blue color is associated with an idle state, i.e. there is no event at that time.
- Whenever an event starts or ends a flag is shown.
- In the middle of an event, the line shows a different color. Colors are assigned depending on the event type.
- The info panel contains the legend of the assigned colors to each event type.
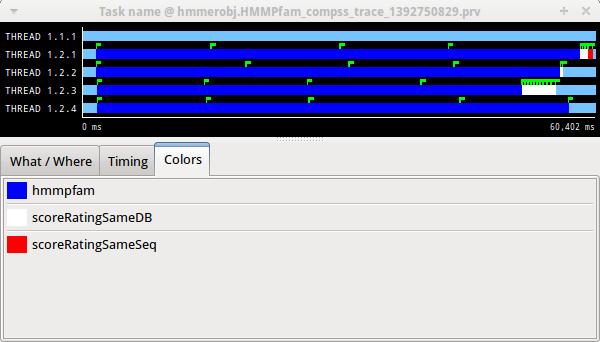
Figure 31 Trace interpretation