Memory Profiling
COMPSs also provides a mechanism to show the memory usage over time when running Python applications. This is particularly useful when memory issues happen (e.g. memory exhausted – causing the application crash), or performance analysis (e.g. problem size scalability).
To this end, the runcompss and enqueue_compss commands provide the
--python_memory_profile flag, which provides a set of files (one per node used
in the application execution) where the memory used during the execution is
recorded at the end of the application.
They are generated in the same folder where the execution has been launched.
Important
The memory-profiler package is mandatory in order to use the
--python_memory_profile flag.
It can be easily installed with pip:
$ python -m pip install memory-profiler --user
Tip
If you want to store from the memory profiler in a different folder, export
the COMPSS_WORKER_PROFILE_PATH with the destination path:
$ export COMPSS_WORKER_PROFILE_PATH=/path/to/destination
When --python_memory_profile is included, a file with name
mprofile_<DATE_TIME>.dat is generated for the master memory profiling,
while for the workers they are named <WORKER_NODE_NAME>.dat.
These files can be displayed with the mprof tool:
$ mprof plot <FILE>.dat
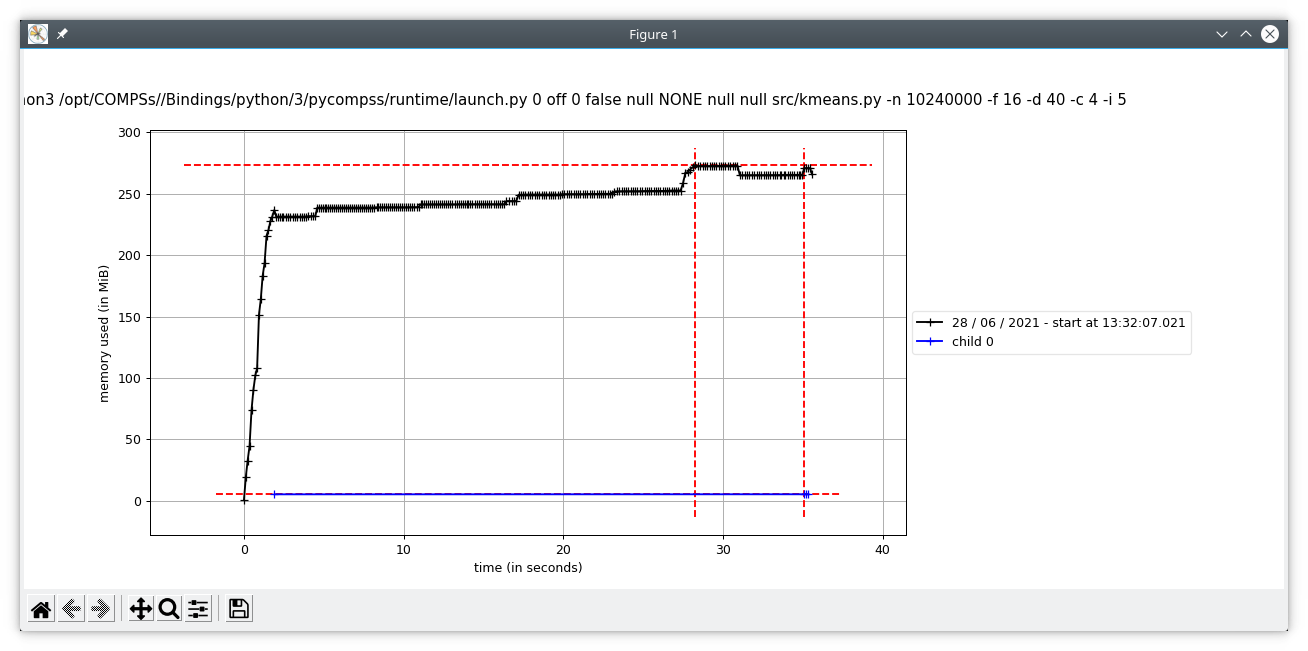
Figure 54 mprof plot example
Advanced profiling
For a more fine grained memory profiling and analysing the workers memory
usage, PyCOMPSs provides the @profile decorator. This decorator is able
to display the memory usage per line of the code.
It can be imported from the PyCOMPSs functions module:
from pycompss.functions.profile import profile
This decorator can be placed over any function:
- Over the
@taskdecorator (or over the decorator stack of a task) This will display the memory usage in the master (through standard output).
- Under the
@taskdecorator: This will display the memory used by the actual task in the worker. The memory usage will be shown through standard output, so it is mandatory to enable debug (
--log_level=debug) and check the job output file from.COMPSs/<app_folder>/jobs/.- Over a non task function:
Will display the memory usage of the function in the master (through standard output).