1.14. Machine Learning with dislib
This tutorial will show the different algorithms available in dislib.
Setup
First, we need to start an interactive PyCOMPSs session:
[1]:
import os
os.environ["ComputingUnits"] = "1"

import pycompss.interactive as ipycompss
if 'BINDER_SERVICE_HOST' in os.environ:
    ipycompss.start(graph=True,
                    project_xml='../xml/project.xml',
                    resources_xml='../xml/resources.xml')
else:
    ipycompss.start(graph=True, monitor=1000)
********************************************************
**************** PyCOMPSs Interactive ******************
********************************************************
*          .-~~-.--.           ______         ______   *
*         :         )         |____  \       |____  \  *
*   .~ ~ -.\       /.- ~~ .      __) |          __) |  *
*   >       `.   .'       <     |__  |         |__  |  *
*  (         .- -.         )   ____) |   _    ____) |  *
*   `- -.-~  `- -'  ~-.- -'   |______/  |_|  |______/  *
*     (        :        )           _ _ .-:            *
*      ~--.    :    .--~        .-~  .-~  }            *
*          ~-.-^-.-~ \_      .~  .-~   .~              *
*                   \ \ '     \ '_ _ -~                *
*                    \`.\`.    //                      *
*           . - ~ ~-.__\`.\`-.//                       *
*       .-~   . - ~  }~ ~ ~-.~-.                       *
*     .' .-~      .-~       :/~-.~-./:                 *
*    /_~_ _ . - ~                 ~-.~-._              *
*                                     ~-.<             *
********************************************************
* - Starting COMPSs runtime...                         *
* - Log path : /home/user/.COMPSs/Interactive_14/
* - PyCOMPSs Runtime started... Have fun!              *
********************************************************
Next, we import dislib and we are all set to start working!
[2]:
import dislib as ds
Load the MNIST dataset
[3]:
x, y = ds.load_svmlight_file('/tmp/mnist/mnist', # Download the dataset
                             block_size=(10000, 784), n_features=784, store_sparse=False)
[4]:
x.shape
[4]:
(60000, 784)
[5]:
y.shape
[5]:
(60000, 1)
[6]:
y_array = y.collect()
y_array
[6]:
array([5., 0., 4., ..., 5., 6., 8.])
[7]:
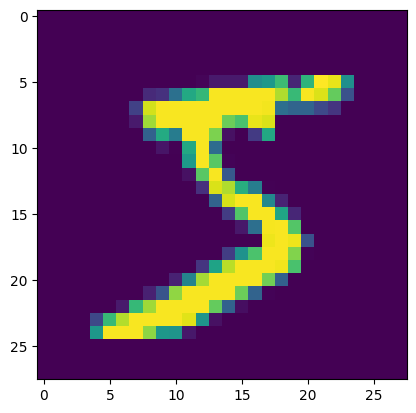
img = x[0].collect().reshape(28,28)
[8]:
%matplotlib inline
import matplotlib.pyplot as plt
plt.imshow(img)
[8]:
<matplotlib.image.AxesImage at 0x7ff14e688e20>

[9]:
int(y[0].collect())
[9]:
5
dislib algorithms
Preprocessing
[10]:
from dislib.preprocessing import StandardScaler
from dislib.decomposition import PCA
Clustering
[11]:
from dislib.cluster import KMeans
from dislib.cluster import DBSCAN
from dislib.cluster import GaussianMixture
Classification
[12]:
from dislib.classification import CascadeSVM
from dislib.classification import RandomForestClassifier
Recommendation
[13]:
from dislib.recommendation import ALS
Model selection
[14]:
from dislib.model_selection import GridSearchCV
Others
[15]:
from dislib.regression import LinearRegression
from dislib.neighbors import NearestNeighbors
Examples
KMeans
[16]:
kmeans = KMeans(n_clusters=10)
pred_clusters = kmeans.fit_predict(x).collect()
Get the number of images of each class in the cluster 0:
[17]:
from collections import Counter
Counter(y_array[pred_clusters==0])
[17]:
Counter({8.0: 3499,
         5.0: 1209,
         3.0: 1058,
         2.0: 323,
         0.0: 121,
         9.0: 54,
         6.0: 45,
         7.0: 21,
         4.0: 16,
         1.0: 9})
GaussianMixture
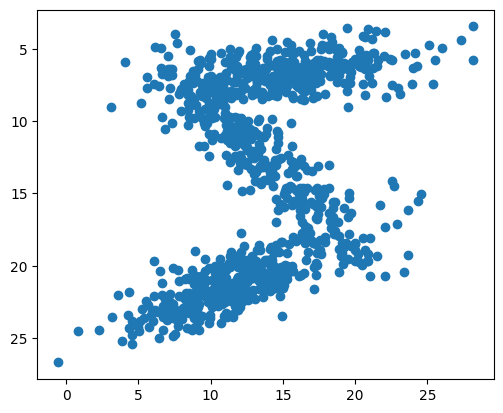
Fit the GaussianMixture with the painted pixels of a single image:
[18]:
import numpy as np
img_filtered_pixels = np.stack([np.array([i, j]) for i in range(28) for j in range(28) if img[i,j] > 10])
img_pixels = ds.array(img_filtered_pixels, block_size=(50,2))
gm = GaussianMixture(n_components=7, random_state=0)
gm.fit(img_pixels)
Get the parameters that define the Gaussian components:
[19]:
from pycompss.api.api import compss_wait_on
means = compss_wait_on(gm.means_)
covariances = compss_wait_on(gm.covariances_)
weights = compss_wait_on(gm.weights_)
Use the Gaussian mixture model to sample random pixels replicating the original distribution:
[20]:
samples = np.concatenate([np.random.multivariate_normal(means[i], covariances[i], int(weights[i]*1000))
                    for i in range(7)])
plt.scatter(samples[:,1], samples[:,0])
plt.gca().set_aspect('equal', adjustable='box')
plt.gca().invert_yaxis()
plt.draw()

PCA
[21]:
pca = PCA()
pca.fit(x)
[21]:
PCA()In a Jupyter environment, please rerun this cell to show the HTML representation or trust the notebook.
On GitHub, the HTML representation is unable to render, please try loading this page with nbviewer.org.
PCA()
Calculate the explained variance of the 10 first eigenvectors:
[22]:
explained_variance = pca.explained_variance_.collect()
sum(explained_variance[0:10])/sum(explained_variance)
[22]:
0.48814980354933996
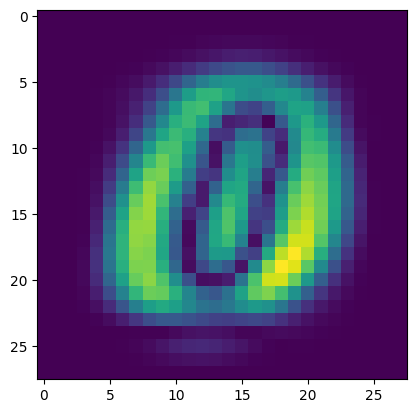
Show the weights of the first eigenvector:
[23]:
plt.imshow(np.abs(pca.components_.collect()[0]).reshape(28,28))
[23]:
<matplotlib.image.AxesImage at 0x7ff144982fe0>

RandomForestClassifier
[24]:
rf = RandomForestClassifier(n_estimators=5, max_depth=3)
rf.fit(x, y)
[24]:
RandomForestClassifier(max_depth=3, n_estimators=5)In a Jupyter environment, please rerun this cell to show the HTML representation or trust the notebook.
On GitHub, the HTML representation is unable to render, please try loading this page with nbviewer.org.
RandomForestClassifier(max_depth=3, n_estimators=5)
Use the test dataset to get an accuracy score:
[25]:
x_test, y_test = ds.load_svmlight_file('/tmp/mnist/mnist.test', block_size=(10000, 784), n_features=784, store_sparse=False)
score = rf.score(x_test, y_test)
print(compss_wait_on(score))
0.6152
Close the session
To finish the session, we need to stop PyCOMPSs:
[26]:
ipycompss.stop()
********************************************************
***************** STOPPING PyCOMPSs ********************
********************************************************
Checking if any issue happened.
Warning: some of the variables used with PyCOMPSs may
         have not been brought to the master.
********************************************************